How to Improve Logistics Engineering Efficiency?
Improving efficiency in Logistics Engineering is not simply a matter of moving more goods, faster. It means coordinating people, equipment, information, and space so each handoff works reliably. Martin Christopher, an emeritus professor of marketing and logistics at Cranfield School of Management, describes logistics as “the process of strategically managing the procurement, movement and storage of materials.” That perspective makes coordination—not speed alone—the starting point.
On a busy distribution floor, a late inbound truck can leave a picking aisle short of stock. A missed barcode scan can then send a worker searching for a pallet that is already nearby. Small delays compound. This article explores practical ways to reduce them: mapping processes, improving warehouse layouts, using dependable data, and matching labor and equipment to demand. Useful measures include order cycle time, picking accuracy, equipment downtime, and cost per shipment. Each measure needs context; a faster process may still create more errors or strain workers.
Technology can help, but it cannot repair a poorly understood workflow by itself. Automated systems, route-planning tools, and real-time tracking are most useful when teams test them against actual operating conditions. The dashboard is not reality. A peak-season shift, a narrow loading bay, or an unexpected product mix can expose gaps that a tidy model misses. Efficiency improvements should therefore be measured, reviewed, and adjusted with frontline feedback. Some changes will disappoint. That is worth acknowledging: a credible improvement plan learns from failed trials instead of hiding them.
Defining Logistics Engineering Efficiency
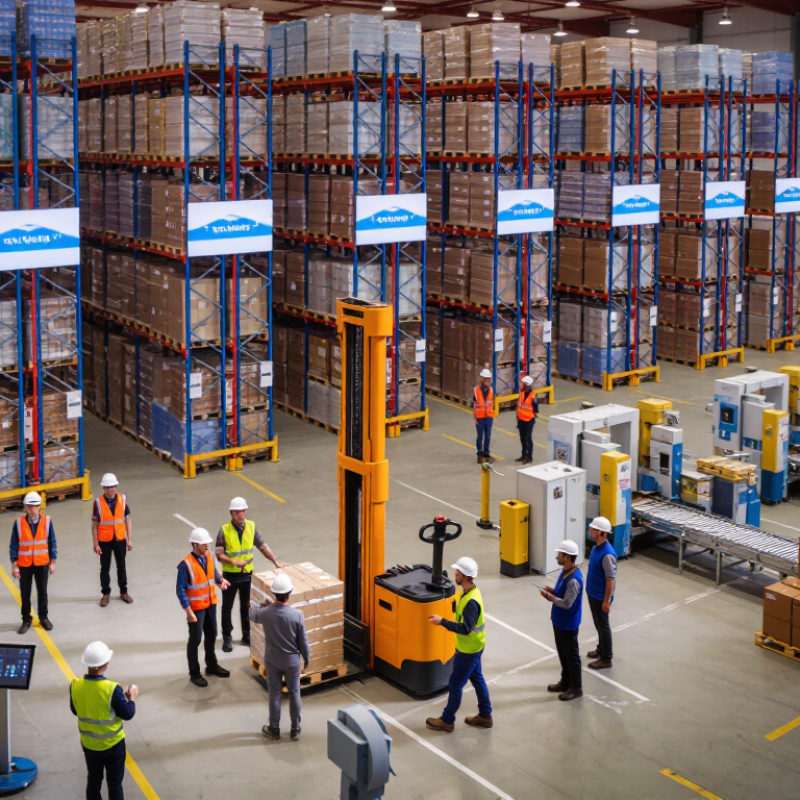
Logistics engineering efficiency is the ability to move goods reliably with the least practical use of time, labor, space, energy, and capital. It is not simply a lower freight bill. A warehouse that cuts staffing but creates late orders may appear efficient on paper and fail customers in practice. Useful measures include cost per shipment, order-cycle time, on-time delivery, inventory accuracy, and energy use per unit moved. These should be tracked together, because improving one metric can quietly weaken another.
The CSCMP 2024 State of Logistics Report estimated U.S. business logistics costs at 8.7% of GDP in 2023, or about $2.3 trillion. This is a broad economic measure, not a target for an individual facility. Still, it shows why small process gains matter at scale. At a loading dock, for example, engineers can compare truck waiting time with labor hours and missed dispatch windows. That distinction matters. Data quality is often the weak link: timestamps may be missing, and planned routes rarely match every real shift. Efficiency definitions should state the measurement period, service standard, and cost boundaries, so teams can tell whether a change improved the whole flow or merely moved the bottleneck.
Assessing Current Logistics Processes and Performance
Improving logistics engineering starts with an honest picture of how work moves today. Map each step, from order release to delivery, and record who handles it, what system they use, and where delays occur. Watch a real shift, not only the process described in a meeting. A pallet waiting beside a loading bay for 40 minutes may reveal more than a polished dashboard. Small gaps matter.
Assess performance with a few clear measures: order cycle time, picking accuracy, dock-to-stock time, and on-time dispatch. Compare results across shifts and product types, since averages can hide recurring trouble.
Check how each measure is recorded before drawing conclusions; mismatched timestamps can make a process look faster than it is. Ask frontline staff what causes rework, then verify their observations with records. The data may challenge your assumptions. That is useful, though sometimes uncomfortable.
Tips: Start with one busy route or work area. Track a week of activity, note exceptions, and confirm the findings with staff. Avoid changing several steps at once; otherwise, it becomes difficult to tell what helped. Some causes will remain unclear at first. Keep investigating.
Identifying Bottlenecks and Improvement Priorities
How to Improve Logistics Engineering Efficiency?
Identifying Bottlenecks and Improvement Priorities
Efficiency work should begin with observed delays, not a new software purchase. Track timestamps across receiving, put-away, picking, packing, and dispatch. Then compare planned and actual cycle times by shift and product type. A queue of pallets beside one dock door may reveal more than a polished dashboard. Small delays compound. Check travel distance, replenishment timing, equipment downtime, and inventory accuracy before changing the whole layout. A tempting shortcut is to blame labor; sometimes the real constraint is a late replenishment task.
Prioritize bottlenecks by their frequency, service impact, and cost to fix. The 2024 State of Logistics Report estimated U.S. business logistics costs at $2.3 trillion in 2023, or 8.7% of GDP. That scale makes small, repeatable gains worth measuring. The 2024 MHI Annual Industry Report, produced with Deloitte, found that 55% of surveyed leaders planned to increase supply-chain technology investment. But investment alone does not prove a process needs automation. Test one change in a defined area, such as re-slotting fast-moving items, and compare travel time, error rates, and throughput against a baseline. Keep the result that holds up across busy and quiet shifts. Still, data lies. Missing scans and inconsistent timestamps can make a weak process look efficient, so validate measurements on the floor before setting priorities.
Applying Technology and Process Optimization
Logistics engineering becomes more efficient when technology supports a clear, measurable process. Start with a specific bottleneck, such as pallets waiting 25 minutes at a loading dock. Track arrival times, scan events, and loading completion before changing the workflow. A dashboard can reveal recurring delays by shift or dock door. Useful, but imperfect. Missing scans and late data can make a smooth process look inefficient—or hide a real problem.
Process optimization turns those findings into practical changes. Map each handoff, from order release to dispatch, and note where staff re-enter information or search for equipment. Then test one adjustment, such as assigning dock doors by shipment type. Set a baseline for travel time, errors, and on-time departures. Still, the neatest process map may not reflect a busy Monday. Ask warehouse staff to check the findings, and revise the plan when real conditions disagree. Avoid adding automation to a step that has not been understood.
Tips: Pilot changes in one work area for two weeks. Compare results with the baseline, check data quality, and record staff feedback. Keep the change only if it improves flow without shifting delays elsewhere.
Measuring Results and Refining Operations
How to Improve Logistics Engineering Efficiency?
Measuring Results and Refining Operations
Efficiency is only useful when teams can see whether a change actually helps. Track a small set of measures: order cycle time, picking errors, dock waiting time, and labor hours per shipment. Define each measure clearly. If one site counts waiting from arrival and another from check-in, comparisons become misleading.
Use a baseline from ordinary operating days, then test one change at a time. For example, moving fast-moving items closer to packing may shorten walking routes. Compare the same shift types and order mix before and after the change. Small differences matter. A two-minute gain can disappear when urgent orders or late trucks are included. Record those conditions, rather than treating every day as identical.
Review results with the people doing the work. A dashboard may show fewer steps, while staff notice that the new layout blocks a replenishment cart. That was our miss. We measured travel distance but not congestion near the aisle. Refine the process, observe another operating cycle, and keep changes that improve service without shifting delays elsewhere. If a metric worsens, investigate the workflow before asking people to work faster.